

Integrating the critical crack size and crack growth into inspection plans makes it possible to move from fixed intervals to a strategy based on integrity and risk, supported by the fracture mechanics of Part 9 of API 579-1/ASME FFS-1.
Traditionally, equipment integrity management has relied mainly on inspections with a prescriptive approach, characterised by fixed time intervals set by codes and standards or by recommendations based on good practice. However, the growing operational complexity of plants and the need to optimise resources have driven the transition towards more realistic approaches that incorporate in-depth knowledge of damage mechanisms, flaw evolution and equipment criticality as the basis for decision-making.
Having information on the failure mechanisms that may be causing the degradation of equipment classified as critical (fatigue due to cyclic loading, general or localised corrosion, stress corrosion cracking, high-temperature creep, etc.), as well as on the rate at which this degradation occurs, is key to anticipating:
- The type of flaw to be expected
- How the potential damage evolves
- The most suitable inspection technique
- The inspection frequency and schedule
Fracture mechanics in inspection planning
Integrating fracture mechanics studies into inspection plans is not only a further step towards more realistic inspection plans, but also towards more effective ones. By carrying out this type of analysis and applying the methodologies set out in Part 9 of API 579-1/ASME FFS-1, it is possible to determine the critical crack size for a given load case and to estimate the remaining life by applying crack growth laws.
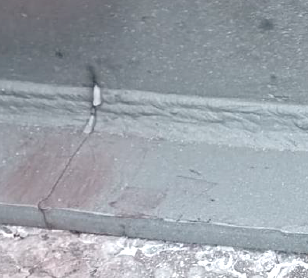
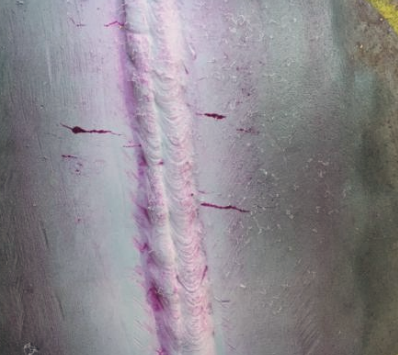
Figure 1. Detail of flaws detected during inspection
Crack characterisation and idealisation
Crack characterisation begins with the assessment and idealisation of its geometry, mainly identifying its length and depth. During inspections, crack length is usually relatively easy to measure, especially when the crack is surface-breaking. Determining its depth, on the other hand, is more complex, and it is often estimated from the component wall thickness or by means of advanced NDT techniques.
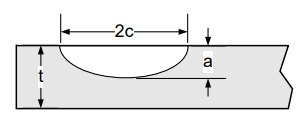
Critical crack size
The critical crack size, ac, is defined as the flaw dimension at which the stress intensity factor reaches the fracture toughness of the material. It depends on the component geometry as well as on the material properties, the stress state and the environmental conditions.
From an inspection standpoint, therefore, knowing the critical crack size means knowing the upper admissible limit for any flaws detected. Being able to compare the observed crack size with the critical size simplifies decision-making and helps prioritise interventions, turning inspection into a tool based on integrity and risk management.
Parameters of a robust inspection strategy
A robust inspection strategy requires three fundamental parameters to be related:
- Assumed or detectable initial size a0
- Minimum size detectable by the selected non-destructive testing method
- Critical size ac
With these parameters, the main objective is to ensure that, within the inspection interval, the size of the inspected flaw remains below the critical crack size and that growth between inspections cannot reach the critical state without prior detection. This is where numerical simulation and automation come into play, allowing the critical crack size under real operating conditions to be predicted with high accuracy through iterative calculations.
Numerical simulation and FAD diagrams
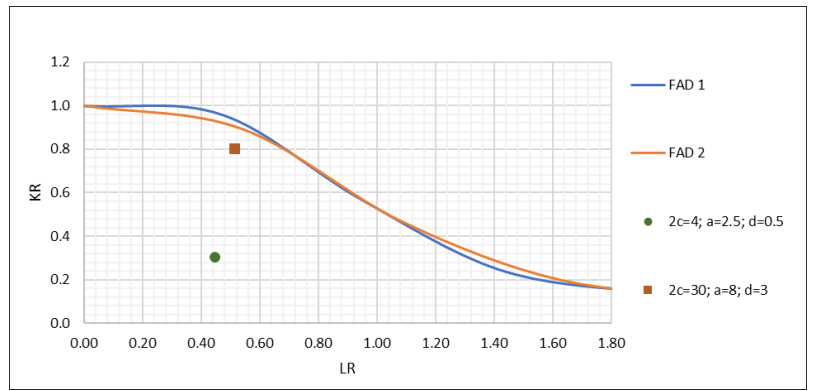
Numerical simulation makes it possible to explicitly represent a flaw in the calculation model and to determine the fracture mechanics parameters needed to assess its stability according to the criteria set out in Part 9 of API 579/ASME FFS-1, including the J-integral. The final objective is to generate FAD diagrams (Failure Assessment Diagrams) and other visual representations that simplify the interpretation of results, making it possible to identify quickly and clearly, even on site, the flaw geometry beyond which it is considered critical.
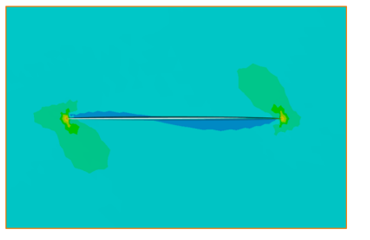
These visual tools make communication easier between the different parties involved in inspection, translating complex fracture mechanics results into clear, easy-to-interpret information.
Integrity, simulation and fracture mechanics with CADE
In this context, the support of a specialist company such as CADE, with in-depth know-how in numerical simulation as well as in integrity and fracture mechanics, brings differential value. Our extensive experience allows us to turn complex model results into practical, reliable information, from the prediction of the critical crack size to the estimation of the damage growth rate under real operating conditions. Thanks to this approach, optimising inspection techniques and intervals is now a reality, making it possible to prioritise resources according to criticality and risk, and to make decisions based on technical data rather than relying solely on prescriptive intervals based on codes or common practice.
Related CADE services: Integrity consulting and forensic engineering · Finite element analysis and simulation
You may also be interested in: Fitness-for-service assessment of crack-like flaws · Occurrence of cracks in pressure equipment · Risk-based inspection (RBI)